INTRODUCTION
The association between TC and the risk of developing atherosclerosis has been established by the Framingham Heart Study.1 Nowadays, there is change in guidelines of the National Cholesterol Education Program Adult Treatment Panel III (NCEP ATP III), which mainly centers based on TC and LDL-C for diagnosis and treatment effects. Therapy is targeted at lowering LDL-C value below a target value, i.e., the primary basis for treatment and appropriate number of patient classification in risk categories.2 The reference method for LDL-C concentration measurement combines ultracentrifugation-precipitation.3 Beta quantitation is costly, tough, laborious, large sample volume is required, and ultracentrifugation is also required. That is why it is not used routinely.4 So, a new generation of direct homogeneous assays for LDL-C determination in serum has been developed with satisfactory degree of accuracy, but it is expensive for using in developing countries.5,6 However, mainly due to the costs of the reagents, Indian laboratories still do not use this.6
Friedewald et al7 described a formula to estimate LDL-C in serum calculated using Friedewald formula (FF) based on used concentration of TC, TG, and HDL-C as an alternative to tedious ultracentrifugation. Because of economic reasons, the calculated method was widely used in clinical laboratories. There are certain limitations of FF, such as use of this formula required fasting sample, TG should be <400, and patients should not have any comorbidities like diabetes mellitus, nephrotic syndrome, hepatic failure, and on hormone replacement therapy because when chylomicron-rich TG is present in serum, it leads to falsely high very-low-density lipoprotein (VLDL) cholesterol and low LDL-C.6,8
Therefore, modified LDL-Cal formulas have been established for estimate LDL-C to be suitable for ethnics pacific population.9-11 Modified Friedewald formula was given by Puavilai and Laorugpongse,11 which assumes that VLDL constitutes one-sixth of total TGs and it is costly for serum LDL test from direct measurement, especially if it has to be tested several times in a year. The authors found that when one-sixth of total TGs was used instead of one-fifth of total TGs, it partially overcame the limitation of Friedewald formula.
Anandaraja et al10 used only two variables like TG and TC and described another formula to estimate LDL-C. Their formula is cost-effective and has low analytical error, which depends on numbers of variables used in the formula.
There are few studies reporting the use of this formula in India, especially in Gujarati population. The formula needs to be validated for routine use in clinical laboratories.
Against this background, the present study was conducted (1) to decide if LDL-C level was underestimated/overestimated after it was calculated using the formulae (original Friedewald, Anandaraja, and modified Friedewald) compared with direct measurement of LDL-C; (2) to choose best calculated method that compares maximum with the direct method with the assumption that the results obtained by direct assay are most accurate.
MATERIALS AND METHODS
Data Collection
We reviewed the records of blood samples which were sent to our Clinical Biochemistry Laboratory, Department of Biochemistry, GMERS Medical College & Hospital, Valsad, Gujarat, India, for the estimation of fasting lipid profile. Secondary data of 500 patients were collected after obtaining prior permission from the concerned authority. The reviewed records referred to the period from October 2016 to February 2017. We included patients in the age group of 18 to 60 years and excluded the patient if TG≥ 400. Fasting samples were collected in plain vial. The samples were centrifuged at 3000 rpm for 15 min to obtain serum and were analyzed for lipid profile on the same day.
TC by enzymatic endpoint cholesterol oxidase/peroxidase aminophenazone method with a coefficient of variation of 4%12
TG by enzymatic glycerol phosphate oxidase/peroxidase method with a Coefficient of variation of 3%13,14
HDL-C by direct homogeneous assay with a coefficient of variation of 3%15
LDL-C by direct homogeneous assay with a coefficient of variation of 3%16
The analysis was done on MICROLAB RX50 semiautoanalyzer and reagent kits obtained from Meril Dignostics.
Calculated LDL-C Estimation
Apart from the above method, LDL-C was calculated by the following formulae:
Statistical Analysis
Microsoft Excel was used for statistical analysis. The results are displayed as numbers and mean ± standard deviation (SD). The study subjects were divided into four groups based on the serum TG levels (mg/dL): Group I: TG <100 mg/dL, group II: TG 100 to 199 mg/dL, group III: TG 200 to 299 mg/dL, group IV: TG 300 to 399 mg/dL. The LDL-C values were compared at different levels of TG.
Statistical significance was demarcated as a two-sided p-value of less than 0.05. As described by Bland—Altman plots, agreement between the two measurements was tested by calculating systematic errors (bias), and 95% limits of agreement (LOA) as bias ± 2 SDs. The percentage error is derived by dividing the LOA by the mean value of the measurements obtained with the established method using the formula: Mean percentage difference calculated LDL-C = (calculated LDL-C — D-LDL-C)/D-LDL-C × 100. Regression analyses are statistical procedures that allow valuable estimations of analytical method agreements and possible systematic bias, expressed in the equation by y=a+bx, where a is the intercept of the line (representing the constant error) and b is the slope in the y axis (representing the proportional error).
RESULTS
The general characteristics of the participants are presented in Table 1. In this study, total of 500 lipid profiles were taken, out of this 39% (195) were females and 61% (305) were males. The mean age, TC, TG, and HDL-C were 49 years, 173 mg/dL, 120 mg/dL, 42.6 mg/dL; and directly measured LDL-C had a mean of 115.6 mg/dL. Of the various formulae, Anandaraja formula produced the mean 106.3 mg/dL, MF-LDL-C mean of 110 mg/dL and F-LDL-C mean of 106.8 mg/dL (Table 2).
The calculated formulae underestimate LDL-C by 4.79, 8.8, and 9.29 mg/dL by modified Friedewald's, Friedewald's, and Anandaraja's method respectively, in comparison to the direct method. On computing the mean percentage difference, it was found that MF-LDL-C differs by 3.5% from the D-LDL-C, which was much lower in comparison to the other two calculated formulae (7.29 and 7.64% by F-LDL-C and A-LDL-C respectively) as per Table 3.
Table 1
Gender-wise distribution of the study subjects
| Number | Percentage | |
|---|---|---|
| Male | 305 | 61 |
| Female | 195 | 39 |
| Total | 500 | 100 |
Table 2
Demographic details of the study subjects
| Parameter | Result (mean ± SD) |
|---|---|
| Age | 49 ± 12 |
| TC | 173 ± 44 |
| TG | 120 ± 64.4 |
| HDL | 42.6 ± 14 |
| D-LDL | 115.6 ± 36.1 |
| F-LDL | 106.8 ± 36.4 |
| MF-LDL | 110 ± 36.9 |
| A-LDL | 106.3 ± 36.3 |
Table 3
Mean percentage difference and Pearson's correlation
| Mean difference | Mean percentage difference | Correlation coefficient (r) | |
|---|---|---|---|
| F-LDL vs D-LDL | −8.8 | −7.29 | 0.92 |
| MF-LDL vs D-LDL | −4.79 | −3.5 | 0.94 |
| A-LDL vs D-LDL | −9.29 | −7.64 | 0.93 |
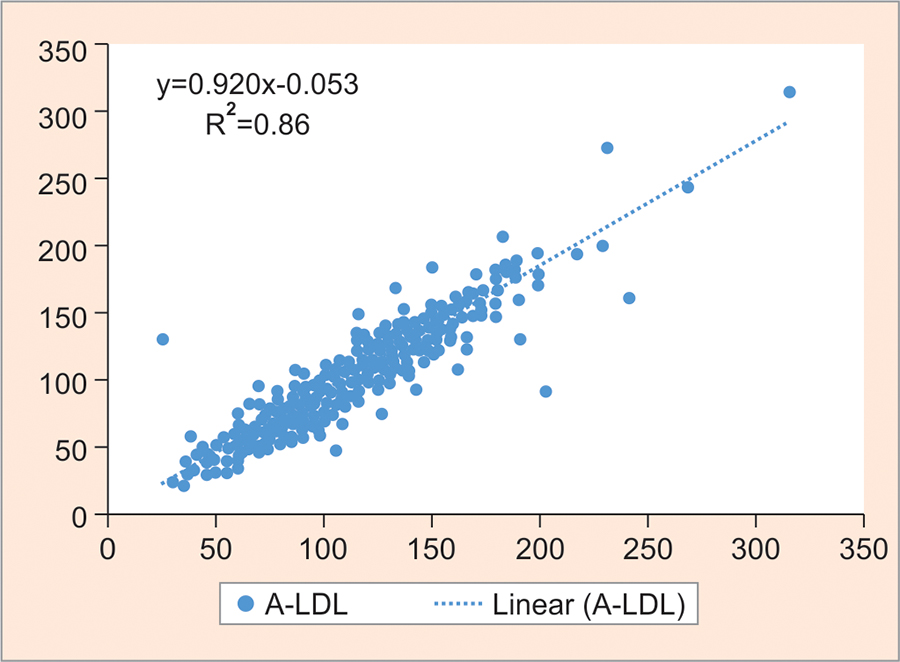
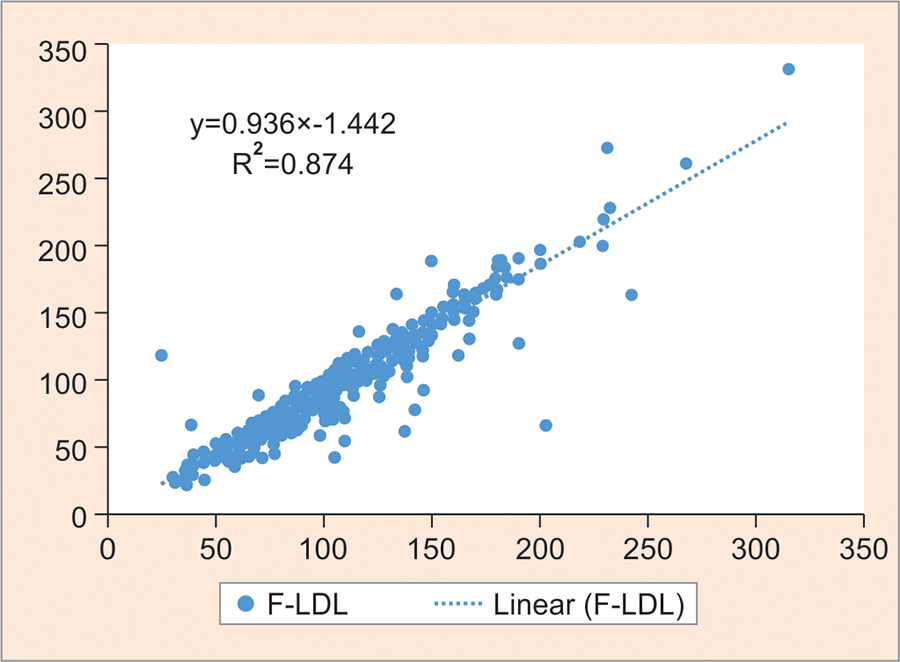
A strong correlation was found between all calculated LDL-C methods and D-LDL-C assay, i.e., A-LDL-C vs D-LDL-C = 0.92 (Graph 1); F-LDL-C vs D-LDL-C = 0.93 (Graph 2) and MF-LDL-C vs D-LDL-C = 0.94 (Graph 3). The modified Friedewald formula showed the best performance for estimating LDL-C, and there was only a small mean difference (3.5 mg/dL) compared with the directly measured LDL-C without both a constant and proportional bias.
According to NCEP ATP III, LDL-C levels of 100, 130, and 160 mg/dL are the treatment goals for low-risk, moderate-risk, and high-risk patients for CHD (Table 4). There is significant difference in risk classification of patients when D-LDL-C was used instead of the calculated one.
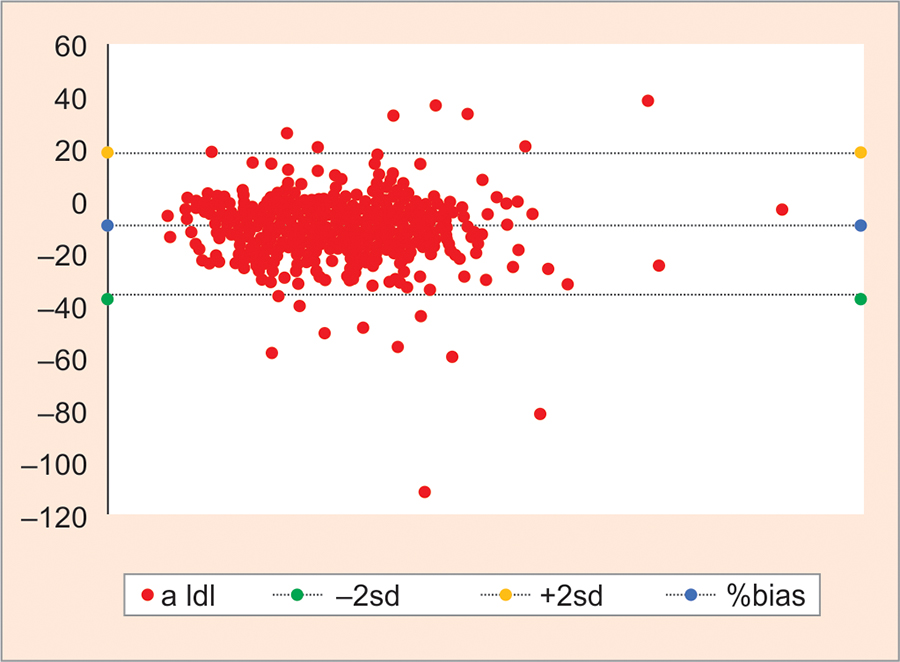
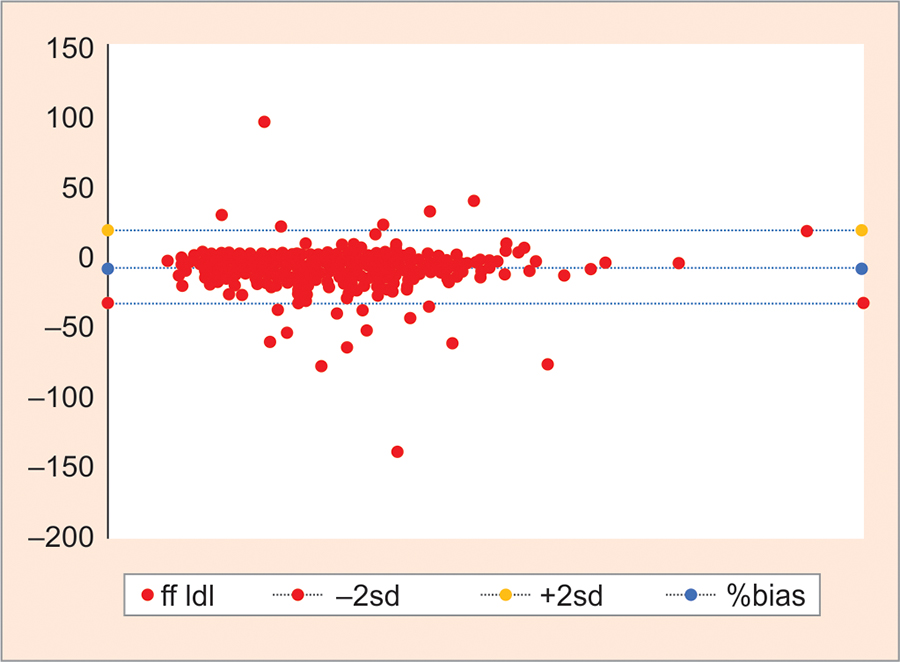
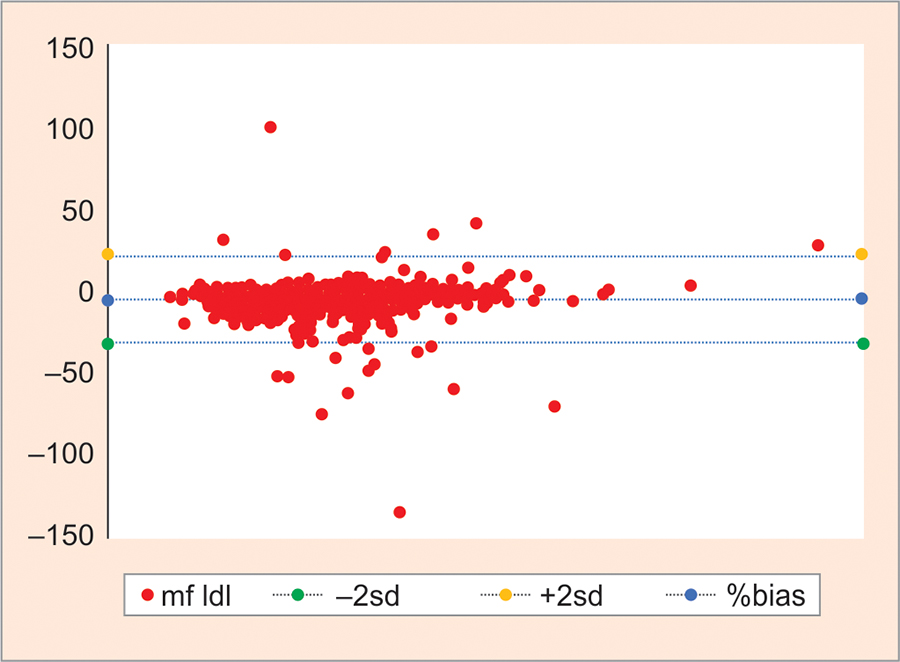
To find the agreement between the direct and calculated LDL methods, Bland—Altman plot was prepared (Graphs 4 to 6), but the negative bias in them indicates that although they correlate to one another they cannot be used in place of D-LDL except the modified Friedewald method where the negative bias was minimum.
Graph 3
Scatter plot of modified Friedewald LDL-C against D-LDL-C. There was a correlation of r = 0.94
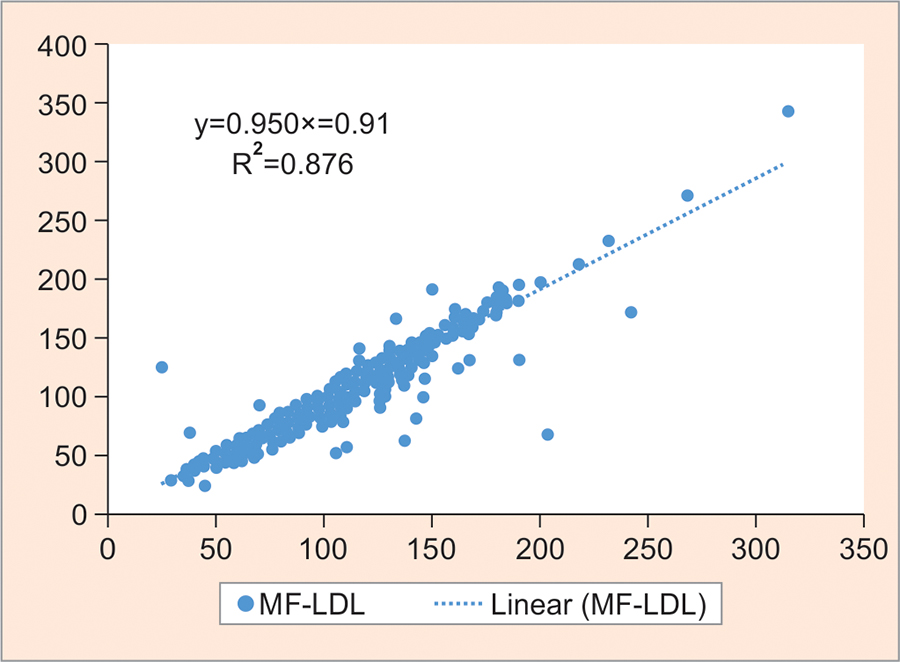
Table 4
Comparison of patient risk classification based on LDL-C levels using direct measurement and calculation formulas
Graph 4
Bland—Altman plot for LDL-C estimated directly and by Anandaraja's calculation. Mean: −9.29 (negative bias), SD: 13.87; mean +2 SD: +18.47; mean −2 SD: −37.05
Graph 5
Bland—Altman plot for LDL-C estimated directly and by Friedewald's calculation. Mean: −8.8 (negative bias), SD: 13.16; mean +2 SD: +17.51; mean −2 SD: −35.1
Graph 6
Bland—Altman plot for LDL-C estimated directly and by modified Friedewald's calculation. Mean: −4.79 (negative bias), SD: 13.18; mean +2 SD: +21.58; mean −2 SD: −31.2
Comparison of LDL-C at different levels of TGs did not show statistically significant difference between D-LDL-C and calculated LDL-C by modified Friedewald's method (M-LDL-C). At TG >100 and <400 mg/dL, a significant difference was found between measured LDL-C and calculated LDL-C at TG <100 as per Table 5.
DISCUSSION
The importance of LDL-C establishes the CHD risk profile as well as the deciding factor of treatment strategies. Serum LDL-C analysis must be precise and accurate.2 For application of Friedwald's formula, recommended analytical quality was <12% total error required, but we were not able to obtain in many Indian laboratories. Anandaraja et al10 described a new formula for calculation in 1,000 Indian patients and after applying multiple regression analysis validated its accuracy. Anandaraja et al entitled that analysis of reliability of their formula in other population was required. To the best of the author's understanding, modified Friedewald formula11 was still not evaluated in Gujarati population. We designed the present study to evaluate the performance of this formula (Friedewald formula, Anandaraja's formula, and modified Friedewald) in Gujarati population.
Overall, there were good correlations between estimated LDL-C and measured LDL-C. Bland—Altman plot was calculated, which revealed negative bias. This suggests that there is the difference in results obtained by calculated and direct method. We found a correlation of 0.93 between F-LDL and D-LDL. This finding is similar to that found in a study done by Kapoor et al17 and other studies where the correlation ranged between 0.78 and 0.93.18-20 The correlation between D-LDL-C and A-LDL-C in our study was found to be 0.92, which was similar to that of other studies, i.e., correlation of 0.93, 0.89, and 0.81.18,19,21 Our study found a correlation of 0.94 between MF-LDL-C and D-LDL-C, which was higher than the one found by Kamal et al18 (r = 0.81) and similar to Kapoor et al17 (r = 0.95).
Table 5
Summary of the measurements of TC, LDL-C (direct), LDL-C (Friedewald), and HDL-C according to TG levels, presented as mean ± SD (lowest level found — greatest level found)
Bland—Altman plots showed a negative bias in spite of the good correlation mentioned earlier. This could be due to a difference in the results obtained by the direct and calculated methods. A similar finding of negative bias was reported in the study by Gupta et al.19 The calculated formulae underestimate LDL-C by 8.8, 9.29, and 4.79 mg/dL by Friedewald's, Anandaraja's, and modified Friedewald's method respectively, in comparison to the direct method. This underestimation was 10.39, 14.77, and 04.02% by Friedewald, Anandaraja, and modified Friedewald respectively, in Kapoor et al17 study. Similar findings were reported by Gupta et al19 that there is underestimation of 10 and 14% with Friedewald and Anandaraja methods respectively. However, Kamal et al18 found underestimation of 17 and 22% by Friedewald and Anandaraja methods respectively. Alternatively, Kamezaki et al22 reported undervaluation of only 5.9% with Friedewald formula.
On calculating the mean percentage difference, it was found that MF-LDL-C differs by 3.5% from D-LDL-C, which was much lower in comparison to the other two calculated formulae (7.29 and 7.64% by F-LDL-C and A-LDL-C respectively). Similar differences were reported in the study by Kapoor et al17 where it was 08.88, 12.62, and 03.44% for Friedewald, Anandaraja, and modified Friedewald respectively. However, in the study by Gupta et al19 it was 8.8 and 11.4% for Friedewald and Anandaraja respectively. As per Vujovic et al,21 these differences were found to be 6.9 and 3.9% for Friedewald and Anandaraja methods respectively. Kamal et al18 found that MF-LDL-C differs by 10.5% from D-LDL-C, which was much lower in comparison to the other two calculated formulae (16.7 and 22.35% by F-LDL-C and A-LDL-C respectively) similar to our study.
The direct method used for measuring LDL-C has very good analytical performance. According to NCEP ATP III, LDL-C levels of 100, 130 and 160 mg/dL are the treatment goals for low-risk, moderate-risk, and high-risk patients with CHD. There was significant difference of risk classification of patients (Table 4). Indeed, many laboratories prefer calculated method because of reagent costs. With a decrease in those costs and a better assessment of the performance of the reagents, the direct methods tend to be more widely used in laboratories, providing a better classification of the patients, with more reliable LDL-C levels, according to the NCEP criteria. Direct LDL measurement is good for diabetic patients, who are susceptible to progress to coronary artery disease.23-25
When D-LDL methods are used to categorize the patients according to NCEP guidelines and for monitoring of CHD, frequent measurement is required, which increases the cost of treatment. Despite being commonly used in clinical decision-making, most of the guidelines suggested sequential measurements to improve the accuracy and precision of LDL-C with intervention.
At different levels of TG, the study found that calculated LDL was always lower than the directly measured LDL-C. This difference increases at levels of TGs <100, but there is controversy in previous study that when TG levels increase, mean difference also increase.18,26
CONCLUSION
The result of calculated methods was not constant and by calculated methods many subjects were misclassified in NCEP cardiac risk categories. New direct homogeneous assays are accurate and precise. Therefore, to categorize the patients according to NCEP guidelines, we choose direct homogeneous assay. Among the three LDL-C formulas, the Friedewald and Anandaraja's formulas give a higher percentage of error compared with modified Friedewald formula. Therefore, modified Friedewald's formula is better than other two formulae for calculating LDL-C in a more cost-effective manner and can be used in large population studies.